|
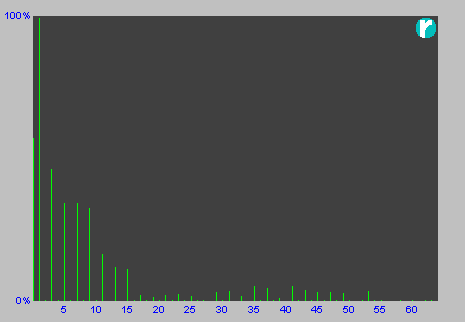
When the current or voltage curve is not a pure sinewave then higher frequency components contribute to the make-up of the waveform. It would be foolish to argue with this statement. However, it is personally felt that far too much emphasis is placed on 'individual harmonics' as opposed to plain old fashioned 'distortion'. You will, no doubt, hear the supposedly 'in-the-know' banging on about 'true RMS' when measuring voltage and/or current i.e. the DC equivalent of the whole cycle (in other words the whole waveform), yet the very same will insist on splitting up a complete waveform into individual frequency components and leave it at that! This is a classic case of double standards (and shows why many specifications are best kept out of the public domain!). Yes, splitting the waveform into handy single frequency sinewave components does make life easier with calculations involving harmonics, but one must treat these as part of a global value - THD. Before I delve into the various aspects of harmonics, I feel it is prudent to revisit a statement made earlier: Harmonics are not generated by non-linear loads. A non-linear load will have a distorted current waveform. Using Fourier's idea, this can be made up of a fundamental and various levels of harmonic sinewaves from the 2nd upwards. For power quality purposes this is usually limited to the 63rd (except some more modern instruments capture all the way up to 255th). The fundamental is always referenced at 100% with each harmonic then measured against the fundamental. A typical harmonic profile of the current of a modern load could look something like what is shown below and we see the various levels of each multiple of the fundamental frequency that makes up the whole waveform.
Breaking down an imperfect waveform into sinewaves of different frequencies at different levels is only part of the story. There is one other important factor being the phase relationship of the harmonic to the fundamental. This phase angle can cause the associated current of the harmonic to apparently flow from the load to the source. This does not really happen and is one of the reasons we view harmonics as a subject where huge amounts of caution should be exercised. Before I expand on phase angles I need to bring to light the small but drastic error in the statement "triple-N harmonics in a 3-phase system add on the Neutral". This is not the whole truth! The phrase should read: "All harmonics of the loads With identical loads equally spread across the three phases, the Neutral harmonic profile shows dominant triple-Ns i.e. odd multiples of three times fundamental, thus giving rise to the statement regarding triple-N harmonics. The reason phase angles are so important is being able to mix and match loads. Some loads may have similar harmonic profiles, but when split across the phases could result in the harmonics cancelling each other. We'll only use an example of two loads each having an equal 3rd harmonic content but the difference in phase angle between the two is 60°. As this phase angle is the zero crossing of the harmonic relative to the point on the fundamental, the actual phase difference of the harmonics is 3 x 60 = 180° meaning the two individual 3rd harmonics cancel each other out. | ||
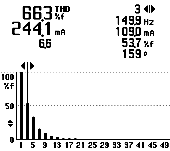 PC Harmonic Profile |
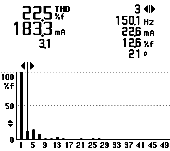 Lamp Harmonic Profile |
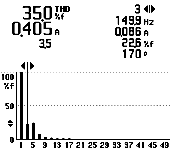 Combined PC + Lamp Profile |
|
It is the very fact the statement above not being quoted in its entirity that has led many to be totally confused when the 3rd harmonic has made its way through a delta-star transformer. At 50Hz it is expected that the three phases are 120° apart and will therefore reflect on the opposite sides of the transformer (voltage in the one direction, and current in the reverse). Loads, in real life, are not equal across the phases, and certainly not equal with regards the phase angles of the various harmonics. If the 3rds were to be 120° lagging across each phase, this would represent exactly what occurs on 50Hz. And if this were the case, would then reflect through a transformer as does the 50Hz. Just because a university lecturer doesn't understand this concept, as it contravenes the theory he teaches, does not mean it cannot happen in practice! Further damage is writers of simulation software also forget this basic point and therefore perpetuate this bad teaching. Whether this is through a lack of knowledge or just basic understanding is niether here nor there. It's just another clear difference between electronics and electricity (which is probably why my Dad is so good as an electrical engineer, because he studied electronics first!). The ruling is simple; Currents that cancel on the Neutral (i.e. 'negatively' combine) will make their way through a delta-star transformer, subject to the losses of the transformer's material at that frequency. Conversely, simultaneous currents combining on the Neutral will result in cancellation currents on the delta nodes within a delta-star transformer (please note: not all currents that combine on the Neutral are simultaneous and may therefore still propogate through a delta-star transformer). Also note that these currents on the delta side are said to be cancelling and not circulating (another terrible error perpetuated throughout the PQ arena). The currents are still found within the individual primary windings; It is at the points these windings connect to one another where such currents will be found to 'negatively combine' i.e. cancel, and therefore not be seen on the delta supply. In the above explanations, it may appear I have vectorially added the currents. I have not done so at all. Note how 'cancelling currents' or 'combining currents' was used so as to stay away from the pitfalls of vectorially summing the harmonic components (something pretty much all of the PQ arena tends to erroneously do - probably because this is done with fundamental based resistive loads).
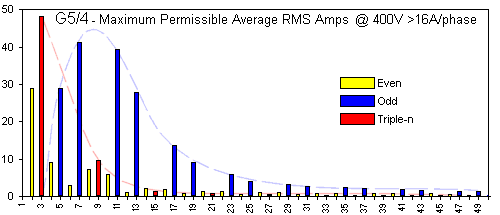
This is not going to be a full-blown explanation of the G5/4 recommendation, but simply a different view to the understanding of maximum permissible currents of the individual high frequency components that form the overall content of large hi-tech loads. The writers of G5/4 understood that combining loads can have harmonics from the distributed load both combine but also cancel by the time one reaches the point of common coupling (the point where the user connects to the mains supply). To achieve this, they developed tables for such combined loads, starting at Stage 1 for 230/400V (3-phase, 4-wire system) where the combined load exceeds 16A per phase (or large loads where the individual device has a current draw exceeding 16A per phase).
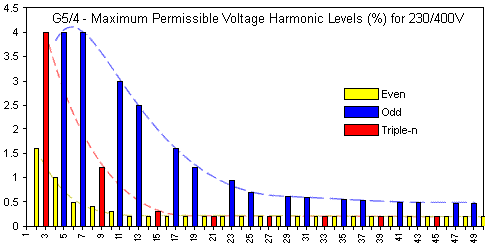
This is the table in graphical format (and it does not take long, using this, to see the trends used). I personally drew this up as I find this easier to plot against rather than playing with individual harmonics against a known or derived tabulated value. It will be noticed, with the exception of a few harmonics, the primary trend is based on a Bezier curve centred on the 8th harmonic (400Hz) with higher permissible limits on harmonics either side of even triple-n harmonics (6, 12, 18, etc.). The odd triple-n harmonics are a based on a hyperbolic curve. The exceptions are the 2nd harmonic which would primarily result from phase shifting, and the 3rd which results from high 3rd harmonic content of single-phase hi-tech loads (trying to reduce the 3rd to follow the trend is nigh impossible, especially as it is a fundamental in its own right!). Their guidelines were to ensure no non-linear load, when connected to the supply, would give rise to voltage harmonic content that exceeded the limits as shown in the graph below.
Please note: This is regardless of the current drawn by the load (watch out for consultants who are unaware of this!). This means you are not allowed to connect anything to the supply that causes voltages exceeding the above limits to appear on the supply. I hope I've made this quite clear!
Please understand one thing; I am not against taking a waveform and splitting it into its harmonic profile, as long as it is accepted that this is only one half of the process. The second half is to bring these figures back into one entity as this is a true reflection of what we are dealing with i.e. one waveform. THD is just that. The process is to take the waveform and split into its various components, as this makes it far easier to work with, but then one needs a little more mathmatics and combine it back into one i.e. to reflect the waveform as a whole. Ah! Now that makes me happy! So you see, the electrical fraternity have got it half right, they just seemed to have forgotten the second half of the process and thus left themselves wide open to issues that may well not exist. Remember, it is one waveform, so we actually only want just one figure to say how unpure it is. The writers of G5/4 have also not forgotten that the G5/4 tables are merely a representative model of the individual high frequencies that make up the overall harmonic content of the current of hi-tech load. Splitting things up in the first place also provides an easy method to get two figures we are very much wanting to get our hands on. Firstly we would like to know the combinations of all the odd harmonics as this is useful in determining the derating factor we should apply to transformers and other devices used in the distribution process. But we are also very interested in the total of even harmonics as these indicate the imbalance of the waveform between the positive halves and negative halves of the cycle. If the RMS of the two halves are equal, then there is no DC component, just a lot of noise finding its way through the system. However, such waveform imbalance seldom results in equal half-cycle RMS values. We need one more harmonic value to help us out of this little spot. But, before we investigate one last harmonic component,...
There is a lot of literature and teaching about claiming you cannot use THD as a means to indicate the overall distortion of a current waveform and/or use it as an indication of a non-linear load's impact on a system. The reason is; THD is relative to either the fundamental or RMS value of the current. The non-linear portion giving rise to the raised THD may remain constant while the more fundamental based loads (e.g. resistive and inductive) may vary dramatically. A typical example is a large plant with limited hi-tech load but many motors (and not driven via variable speed drives) will have a low THD as the non-linear load only forms a small portion of the overall current. Come nightfall, and the plant is halted, the non-linear portion of the load is likely to become significant thus shooting the THD skywards. Before continuing, I just want to recap on something said earlier; Voltage harmonics arise through the impedance of the imperfect source being subjected to the non-linear characteristic of the load. As the real-time non-linear resistance of the load is nigh impossible to measure, current is the next best thing. The current is then worked against the known impedance so as to limit the amount of harmonic voltage. In this above paragraph, it can be seen the absolute harmonic current is a better figure than the THD as a percentage when wishing to calculate the impact of hi-tech loads on a supply. Yet such a figure is very easy to get; One simply multiplies the percentage against the value the THD is relative to (either fundamental or RMS). Because this is an extra step required in the process, many are lazy and opt for using the individual harmonic currents as given to them via their prized piece of PQ kit. This comes with pitfalls, the biggest being the harmonic components of a non-linear load are treated as "emissions". This error comes from forgetting the term "non-linear" is the indication of a hi-tech load's characteristic being the real-time resistance of the load changing throughout the cycle. As resistors do not store energy as do inductors and capacitors, they do not have the ability to return any energy to the source. THD is a very real and necessary figure as an indication of the extent of non-linear behaviour of a load (the amount the real-time resistance changes) and needs to be used in conjunction with the relative unit (fundamental or RMS) to indicate the true impact on the source.
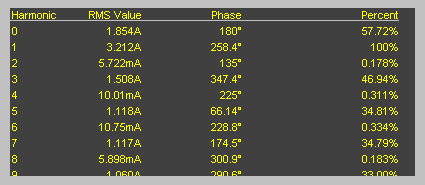
Above is the text printout of the above graph. This shows the current associated with each harmonic as well as the phase angle relationship with the fundamental. There is a very interesting harmonic called "Harmonic 0". As the fundamental multiplied by zero is zero, the frequency associated with this harmonic is therefore also zero i.e. DC. This is a very real 'harmonic' and is derived from curve imbalance (i.e. a non-symmetrical waveform) mainly as a result of (but not limited to) for example unequal or damaged (blown open) diodes in rectifier bridges - and an AC load causing bad waveform symmetry is reflected in a high total even harmonic content. One can not ignore such DC component as it can effect the AC system performance quite drastically - and is of very real concern if this figure is high as transformers change magnetic characteristics (often going into hysteresis), resulting in extreme heat loss. Having a high DC component but low total even harmonic content indicates either a large amount of DC component being injected (e.g. a DC to AC inverter not functioning correctly), or the instrument simply having a large DC bias.
© 22.11.03 / 24.11.05 |
||
 INTERPRETING THE READINGS: